Amidst the excitement and hype surrounding artificial intelligence, the significance of data engineering and its critical foundation—data modeling—can often be overlooked. This article is the first in a three-part series that will shine a spotlight on the fascinating world of data modeling, delving into its crucial importance within the broader context of data engineering. We will explore the history of data modeling, pioneered by visionaries like Kimball and Inmon, and discuss the necessity for a comprehensive understanding of data architecture in today’s data-driven world.
In this opening article, we will lay the foundation for understanding data modeling, its relevance to data engineering, and the indispensable role it plays in creating structured representations of an organization’s data. By illustrating the relationships, constraints, and patterns within data, we can design efficient systems, such as data warehouses, lakes, or analytics solutions, that deliver maximum business value. As we dive deeper into the subject, we will unravel why data modeling is essential for successful data projects, discuss how to avoid pitfalls like “quick and dirty” MVPs, and unveil key concepts of data modeling, including normalization and metrics. Stay tuned for a journey through the world of data modeling within data engineering.
Introduction to Data Modeling
Let’s start with what is data modeling.
What Is Data Modeling?
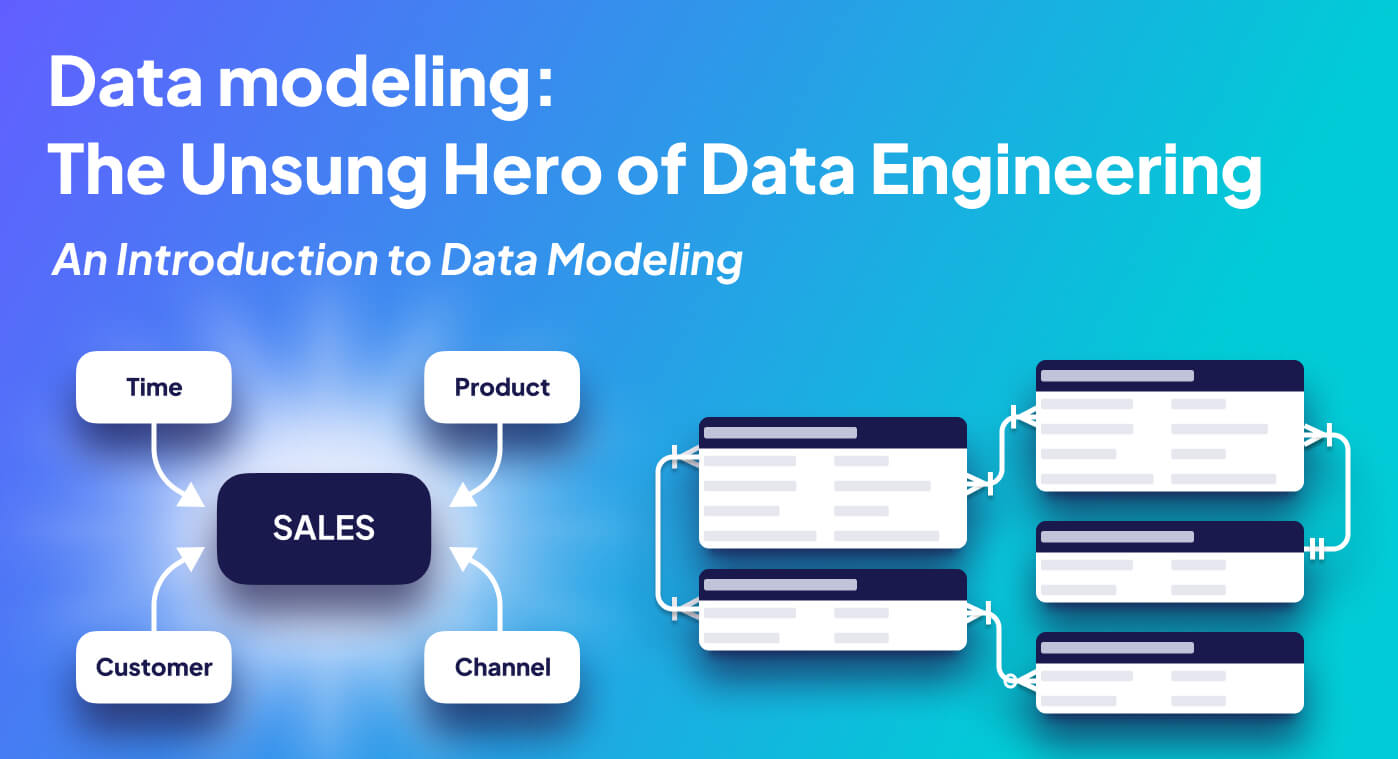
In the context of data engineering, data modeling creates a structured representation of your organization’s data. This representation, often illustrated visually, helps understand the relationships, constraints, and patterns within the data and serves as a blueprint for gaining business value in designing data systems, such as data warehouses, lakes, or any analytics solution.
In its most straightforward form, data modeling is how we design the flow of our data such that it flows as efficiently and in a structured way, with good data quality and as little redundancy as possible.
Why Is It Important in Data Engineering?
In an ever faster-growing and changing data landscape, having a clear data structure and architecture in place is essential. The best way is to have a good data model and strategy.
An essential part of data modeling is the business logic, which gets integrated inside the data flow either as SQL/Python code, some drag-and-drop ETL tool, or inside a modern Business Rule Engine.
Most data projects initially ignore data modeling because of time constraints, fast-paced development, or sometimes lack of knowledge. Instead of investing time into sketching out how the data should flow from its source, the organization’s requirements, to how the end user wants to analyze its data, projects get built quickly and with a “dirty” MVP.

Data modeling goes hand in hand with clear goals. It integrates technical and data requirements as well as business and performance requirements. With these, aligned within the company, it’s much easier to understand the business from a data perspective and be successful in the long run.
Different Levels of Data Modeling
Data modeling can be applied at different levels and contains more than just modeling. Besides the conceptual, logical, and physical data model, you can model your source OLTP database, warehouse, BI tool, and ML features. More importantly, we discuss further in this article the overall data modeling across the organization.
In the end, each layer of the Data Engineering Lifecycle can be modeled. To name just a few:
- Generation or source database: Model the entities of your application’s source database, and normalize tables to its Third normal form (3NF). Choose the best features of the database of choice.
- Data integration and ETL processes: Define the source-to-target mappings, transformations, and data cleansing rules to move and consolidate data from multiple sources into a data warehouse or other central storage.
- Data warehouse (Analytical level): Creation of denormalized or multi-dimensional models, such as star or snowflake schemas, enabling efficient querying and data aggregation.
- Data lake: Applied to create a consistent structure, catalog, and metadata management strategy for diverse and often unstructured data sources to improve data discovery, governance, and accessibility.
- BI tools and reporting (Presentation level): Designing the data structures, aggregations, and calculations used in reporting and visualization tools. Building the presentation layer may involve creating semantic layers, such as data cubes, that simplify business users’ access to the underlying data.
- Machine learning and AI: Feature engineering, normalization, and data encoding to ensure compatibility with various algorithms and tools.
Considering these different levels, the key is to model the business requirements end to end. Sometimes these are modeled inside Business Rules where calculations and processes organization are stored. By integrating business logic into data modeling, organizations can ensure that their data architecture is aligned with their objectives and supports effective decision-making.
The History of Data Modeling: A Quick Recap
To understand data modeling, we must examine the history and see where the term started. The history of data modeling has evolved over the years with changing technologies and requirements. This evolution can be broadly divided into a few key phases:
- Early days of data management (1960s-1970s): The first databases and data models emerged. The hierarchical and network data models were the primary data modeling techniques, laying the foundation for more advanced data models. BI and data warehousing were still in their infancy.
- Emergence of relational databases (1980s): The relational model, introduced by Edgar F. Codd, revolutionized data modeling and management. Relational databases enabled the development of the Entity Relationship Diagram (ERD) model, which became the dominant approach to designing and implementing databases for transactional systems.
- Birth of data warehousing and BI (1990s): BI and data warehousing gained prominence during this period. Ralph Kimball introduced dimensional modeling, becoming the standard for data warehouse design. Bill Inmon proposed another approach, the top-down approach, which focused on creating an enterprise-wide, normalized data model. Kimball’s and Inmon’s approaches addressed the challenges of analyzing and reporting data for decision-making.
- Expansion of data sources and big data (2000s): As organizations started collecting and analyzing data from various sources, including the web and social media, the volume, variety, and velocity of data increased significantly. This data growth led to the emergence of big data technologies and platforms like Hadoop, NoSQL databases, and data lakes. Data modeling in this context had to adapt to the changing landscape, incorporating new data types and storage systems.
- Modern data engineering (2010s - present): With the decline for computation the rise of cloud computing, advanced analytics, and machine learning, data engineering has evolved to handle increasingly complex and diverse data ecosystems. Data modeling in the modern data engineering landscape needs to accommodate various data sources, formats, and storage technologies, such as cloud-based data warehouses, data lakes, and real-time streaming data.

In the context of modern data engineering, data modeling focuses on creating flexible, scalable, and efficient data models that cater to diverse analytical and processing requirements. New techniques like data vault modeling, data mesh, and others have emerged, and we’ll discuss the differences later in part two.
Why has Data Modeling lost its popularity?
While working in the data ecosystem from 2003 until now, I could follow the transition hands-on.
One possible reason it lost popularity is that a small dedicated team of engineers usually set out to modernize the old data platforms within the organization.
Due to a lack of time and resources, these small teams get pressured to deliver a valuable product to the business immediately after showing a working MVP. So instead of taking enough time to develop a strong foundation, the team patches the MVP version to be used in production.
This fast approach might be ok to begin with, as you can test your assumption if the new way is speaking to the business people at all or not. Taking a step back after the approval and aligning on the big picture would be a better step in most cases.
Why Did the Importance of Data Modeling Rise?
After the boom and explosion of the data landscape, people have realized that a solid data architecture and choice of tools matter a lot regarding the success of a data-driven culture and the cost of using data. Therefore making it relevant for today’s data challenges. With more requirements and near real-time analytics on the rise, we need faster ways to analyze data. The organizations need help with Data Governance as more data we need to ensure better data quality, consistency, and compliance with regulations such as GDPR and CCPA.

With all these challenges, focusing on the critical part is tricky. That’s where data modeling comes in, zooming in on the business outcome and aligning data modeling around it. Data modeling helps with seeing the end-to-end data flow from a higher level. Instead of thinking in your small garden ahead, you zoom out and see the whole field. The outcome is a clear strategy, solid data architecture, and more straightforward solutions.
That’s why data modeling and, with it, dimensional modeling is getting popular again. People recommend it on social media, giving talks on “Is Kimball still relevant,” and even writing books about it, e.g. Joe Reis on “modern” data modeling practices, or Serge Gershkovich writing about Bringing back Data Modeling.
Let’s next look at how data complexity can be reduced with data modeling and help us see the big picture.
The Complexity of Data
Data and its ecosystem is rapidly getting more complex. Especially when working with data—data is always outdated, dependent on third-party tools or services, and you have multiple sources and even systems. All of this makes data very hard to work with.
Besides these apparent difficulties, modeling data is even more complex. It would be best to think about storing data, transforming, aggregating, the right granularity, rolling them up, and much more. These are things we’ll cover in this chapter.
Big-O Notation, Why It Matters
Moving data can grow exponentially fast if you have no focus on modeling your data well. If you do not know about that, you are probably not delivering on good performant code. It’s close to programming with the Big-O notation. In essence, it defines the complexity of a function in a constant-time O(1), linear-time O(N), or quadratic-time O(N^2).
Suppose you don’t take care of the times of copying a slightly different version of your dataset, essentially how the data flows through your organization. In that case, a lot of redundancies and high costs can result.
As data engineering can (and should be) seen as a function of computation (idempotency) that is applied to your data, you can see how the complexity of copying data can get to O(N^2) pretty fast.
Granularity and Roll Up, Why These Are Important
Granularity is related and essential to think about. The grain of your data defines with which details you store, adding to the duplication if you are not careful. For example, if you want to have one data aggregated by countries and another one with full details on each city, time, and user, with modeling, you can store it once and aggregate it on top.
There are techniques to help against duplicating called roll up. Roll-ups drastically reduce the amount of data to store, in case you don’t need these details. It keeps aggregates for faster query times to avoid duplicating all rows. For example, Druid and other databases have such features built-in.
Data Modeling to the Rescue
So what is the solution to complex data? If we see data engineering through the lens of data modeling, I am optimistic that we have an angle to work against these forces and keep the complexity of storing data low.
Key Concepts for Data Modeling
After introducing data modeling, let’s look at key concepts of data modeling that apply to all data modeling techniques before we dive into each of the different data modeling techniques.
Metrics/KPIs
Metrics, KPI and (calculated) measure are terms that serve as the building blocks for how business performance is both measured and defined, as knowledge of how to define an organization’s KPIs.
It is fundamental to have a common understanding of them. One step ahead, metrics are typically shown in business reports and dashboards with direct access to the entire organization. Metrics relate to data modeling as a way of defining goals. You must define them to know what you build the data stack for. With metrics agreed upon across the organization, you create a data model leading you there.
Normalization: Normalized vs. Denormalized
Normalization, created by Edgar F. Codd, is a fundamental concept in relational data modeling aimed at minimizing redundancy and ensuring data consistency by avoiding multiple instances of stored data. A redundancy-free relational data model is often referred to as a normalized data model or as a data model in Third normal form (3NF). In contrast, OLAP cubes and analytics solutions generally use dimensional modeling with dimensions and facts, which is optimized for fast query latency.
In practice, creating relational data models usually involves implicitly designing a model in the 3rd normal form without going through individual normalization steps in detail. Data can be categorized into master data and transactional data, where master data describe business objects with properties that can change over time, and transactional data represents specific business events tied to the time of the event.
One well-known technique that emerged with “big data” is the One Big Table (OBT) approach, which creates a wide denormalized table containing all dimensions within the required granularity. Storing data in OBTs simplifies queries by eliminating the need for joins and offers faster response times, especially when using columnar storage formats. However, managing OBTs can be challenging, as updating or backfilling dimensions requires modifying many rows. Data Lake Table Formats have made this process more manageable.
The concept of OBT is not new; materialized views in Oracle were used similarly in the past. The choice between normalization and denormalization depends on the specific use case, storage capabilities, and query performance requirements. Both approaches have advantages and limitations, and data engineers must carefully evaluate these factors to design an effective data model.
History or Slowly Changing Dimension (SCD)
If your organization needs to keep track of history and what has changed, either from a legal perspective or a pure analytical. These decisions must be taken early on and can influence the data modeling part quite a bit.
The most common approach is the Slowly Changing Dimension (Type 2). A Slowly Changing Dimension (SCD) is a dimension that stores and manages current and historical data over time in a data warehouse. It is considered and implemented as one of the most critical ETL tasks in tracking the history of dimension records.
Other approaches are introducing snapshotting of everything. With the new data lake table formats, you have the capabilities of Time Travel, which essentially lets you go back and see each change that has been done. Be careful, though. The consequence is storing all your data multiple times and influencing how you query the data. You should add a timestamp like the as of date to your query. You jump back in time and query the data as the end of last year if you snapshotted the state of this date. Another technique is Bitemporal Modeling; more on that in part two.
Modeling history is also different from the type of data (master and transaction). Master data, such as addresses, can change over time, whereas transactional data, such as account transactions, mainly adds a new row. A common challenge is that multiple versions of a particular data record may exist. Still, relationships do not refer to a specific version but rather to the overarching entity (i.e., the element to which the versions belong).
Entity Relationship Diagram (ERD)
An Entity Relationship Diagram (ERD) is a visual representation used in data modeling that illustrates how entities, typically tables within a database, relate to each other within a system.

ERDs help design or debug relational databases. As a part of data modeling, ER Diagrams utilize a set of symbols, such as rectangles, diamonds, ovals, and connecting lines, to depict the interconnectivity of entities, relationships, and their attributes.
These diagrams mirror the grammatical structure, presenting entities as nouns and relationships as verbs, providing an intuitive and organized way to understand the structure and relationships within a data model.
What’s Next?
This article is already quite long, and I decided to break it out into a three-part series.
In this part, we explored the importance of data modeling in data engineering, the history of data modeling, and the increasing complexity of data. We have also touched upon the significance of understanding the data landscape, its challenges, and the critical role of business requirements in driving successful data projects.
As seen, a solid foundation in data modeling helps organizations create efficient, scalable, and flexible data architectures that cater to various analytical and processing needs. As we progress in this series, we will delve deeper into the intricacies of data modeling techniques, patterns, and best practices.
In part two, we will discuss different data modeling techniques, such as dimensional modeling, data vault modeling, and data mesh, among others. We will also explore various data modeling approaches that help organizations build scalable and maintainable data systems. The second part of the series will provide insights into choosing the right modeling technique for your organization, considering your unique requirements, challenges, and goals.
In part three, we will delve into data architecture patterns, tools, and the future of data modeling. Stay tuned as we explore the fascinating world of data modeling within data engineering and its impact on the future of data-driven decision-making.
Originally published at Airbyte.com